In Towards a blueprint, the national Marine Biodiversity Hub distils the findings of more than eight years of research supported by the Australian Government.
Towards a blueprint shows how Australia can expand its institutional capacity to meet the reporting needs of the Department of the Environment. It identifies existing data for areas where monitoring can begin, and assesses Australia’s capability to collect new monitoring data as a basis for decision making.
This evidence-based approach is essential to understanding why ocean systems are changing across the third largest ocean territory in the world.
Key Ecological Features (KEFs) are parts of the ocean that are identified in the Australian Government’s marine bioregional plans as highly valued for their importance to biodiversity or ecological function and integrity. As such, they are an important starting point for developing monitoring in the Commonwealth Marine Area.
Fifty-four KEFs have been identified in Commonwealth waters during marine planning processes. As the map of Australia illustrates, KEFs come in many shapes and sizes and Towards a blueprint divides them into six groups for reporting purposes. These are areas of enhanced pelagic productivity, canyons, deep seabeds, seamounts, shelf reefs and seabeds.
While the oceanography of most KEF groups has been studied, the level of biological sampling varies. Areas of enhanced pelagic productivity are the best understood, and shelf seabeds and deep seabeds the least.
To provide a foundation for monitoring and reporting, qualitative ecosystem models were built for 33 KEFs. The models are based on a conceptual understanding of how the KEF systems function, gained from regional specialists. Many KEFs have several slightly different models (model groups) that allow for uncertainties in understanding.
Regional specialists were also consulted to identify the human pressures thought to affect each KEF. These pressures were combined with the KEF ecosystem models to create medium-term pressure scenarios. Between four and 25 pressure scenarios were identified for each KEF (including combinations of pressures).
Most human pressures, including those associated with fishing, shipping and oil and gas activities, are well documented. The effects of climate change pressure on KEFs are varied, and may include increased water temperature, and changes to ocean currents (such as the East Australian Current) and upwellings (such as the Bonney Coast Upwelling).
The KEF models encompass components of the ecosystem, such as phytoplankton, that have potential to be monitored as long-term indicators. These components may increase, decrease, or remain unchanged under each pressure scenario, but sometimes in unpredictable directions. The ideal indicators for each KEF are those that respond in predictable ways across all its pressure scenarios.
For the nine enhanced pelagic productivity KEFs, the predicted response to pressure scenarios of some indicators has been compared with empirical observations. This demonstrates the ‘prediction followed by observation’ philosophy that underlies the blueprint approach to indicator selection. For example, satellite observations were analysed to tease out the long-term trend in phytoplankton biomass and ocean upwelling.
In the example of the Bonney Coast Upwelling KEF, the indicators that respond in a predictable way across all five pressure scenarios are phytoplankton, upwelling, krill, blue whales, and nutrients in the sunlit zone. Of these, observed trends are available only for phytoplankton and upwelling. Sustained observations of krill, blue whales and sunlit-zone nutrients, however, are not available, but could be prioritised in a monitoring program.
Note: Not all Key Ecological Features (KEFs) are shown here as some have yet to be mapped in detail.
(Key and text description)
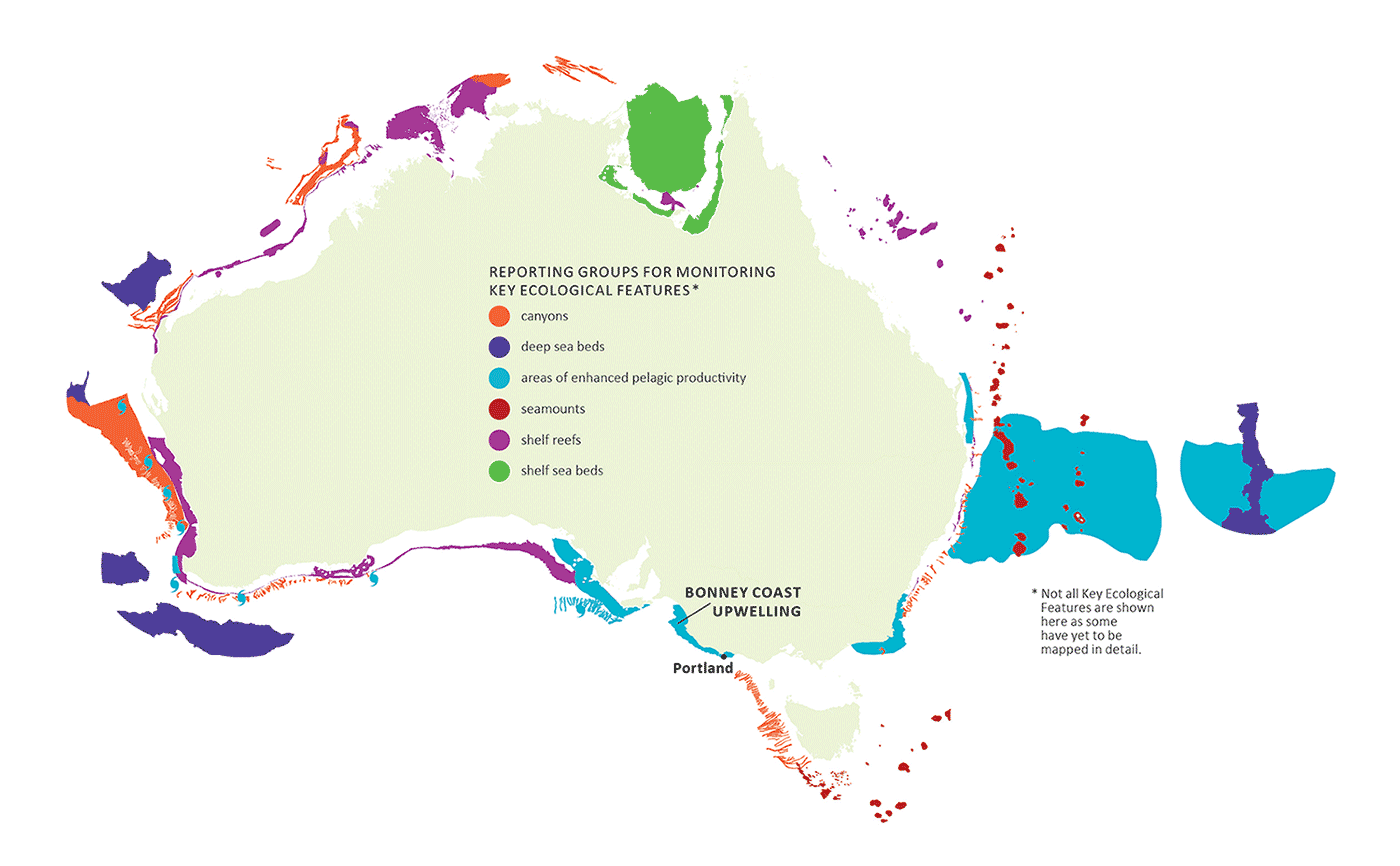
 Canyons: around all area of Australia except Queensland coast and Great Australia Bight).
 Deep sea beds - sections extending off Western Australian coast from Port Headland to Esperance and in the Pacific Ocean just north of New Zealand.
![]() Shelf reefs - regions off Queensland mid north coast, Great Australian Bight, Western Australia's south east coast and northern coasts, and Northern Territory.
Shelf reefs - regions off Queensland mid north coast, Great Australian Bight, Western Australia's south east coast and northern coasts, and Northern Territory.
 Seamounts - scattered in the outer EEZ areas from mid-Queensland coast to south of Tasmania).
 Area of enhanced pelagic productivity - spanning offshore from New South Wales coast into Tasman Sea, north of New Zealand being the two largest regions, east coast of Victoria, around South Australia Coast, adn several small regions around southern Western Australia coast.
 Shelf sea beds - significant area of the Gulf of Carpentaria including coastal areas in this region.
The process of comparing predicted and observed trends in indicators provides consistent information on the effects of pressures, and leads to an improved understanding of KEF systems. If indicators behave as predicted, confidence in system understanding will increase, and so will the usefulness of the indicators for reporting on status and trends for biodiversity, ecological function and integrity.
A change in indicator trend would be a signal to managers and other stakeholders that something was happening to a valued system. The prediction-observation process would help to explain why. This process is repeatable and can be updated as new information comes available.
Australia has the capacity to deploy a wide range of monitoring equipment and to embrace new technologies as they become practicable. Towards a blueprint identifies a broad range of monitoring gear, and determines which gears can be cost-effectively and routinely deployed to collect KEF indicator data for reporting on status and trends.
For example, earth observing satellites are a useful means for monitoring enhanced pelagic productivity KEFs (where phytoplankton is a key indicator). Instrumented gliders and sub-surface profiling floats would also suit these areas, and have relatively low deployment constraints.
Areas that are more difficult and more expensive to monitor, such as canyons and seamounts, present the greatest challenges. Remote autonomous underwater vehicles are suited to these KEFs, but few are available in Australia due to the relative expense of deep water operation and deployment. They are likely to become more affordable, however, as technology advances, and one day may be deployed routinely in relatively large numbers.
Existing data relevant to KEFs have been collated in the Australian region marine data aggregation tool (ARMADA). ARMADA locates and tallies physical and biological observations, highlighting potentially useful datasets and the adequacy of data at a national scale.
Government agencies and stakeholders can share and link their monitoring data via the Australian Ocean Data Network.
Implementing a sustained KEF monitoring program involves extending observations, analysis and data management to allow national and regional reporting on status and trends in KEF indicators. Towards a blueprint identifies options that would support a staged implementation of such a program.
An investment strategy for future monitoring should consider influencing and accessing national marine infrastructure and assets such as the Integrated Marine Observing System and the Marine National Facility research vessel Investigator, as well as working with industry partners. These considerations should be made in the context of the National Marine Science Plan.
Good governance is a prerequisite for effective monitoring and reporting and will be needed to transition from research to operational monitoring. It should provide vision, leadership and supervision on goals, practices and procedures, and coordinate groups involved in the collection, management, analysis and reporting of monitoring data. Australia has existing groups that could take on this role.
Existing knowledge is sufficient to begin monitoring in more than half of Australia’s KEFs, provided this is supported by ongoing research and analysis. Existing knowledge is insufficient, however, to develop even a conceptual understanding for 42% of KEFs. Filling this knowledge gap is critical for Australia to develop a comprehensive understanding of the state of its oceans, and is a research priority for the National Environmental Science Programme Marine Biodiversity Hub.
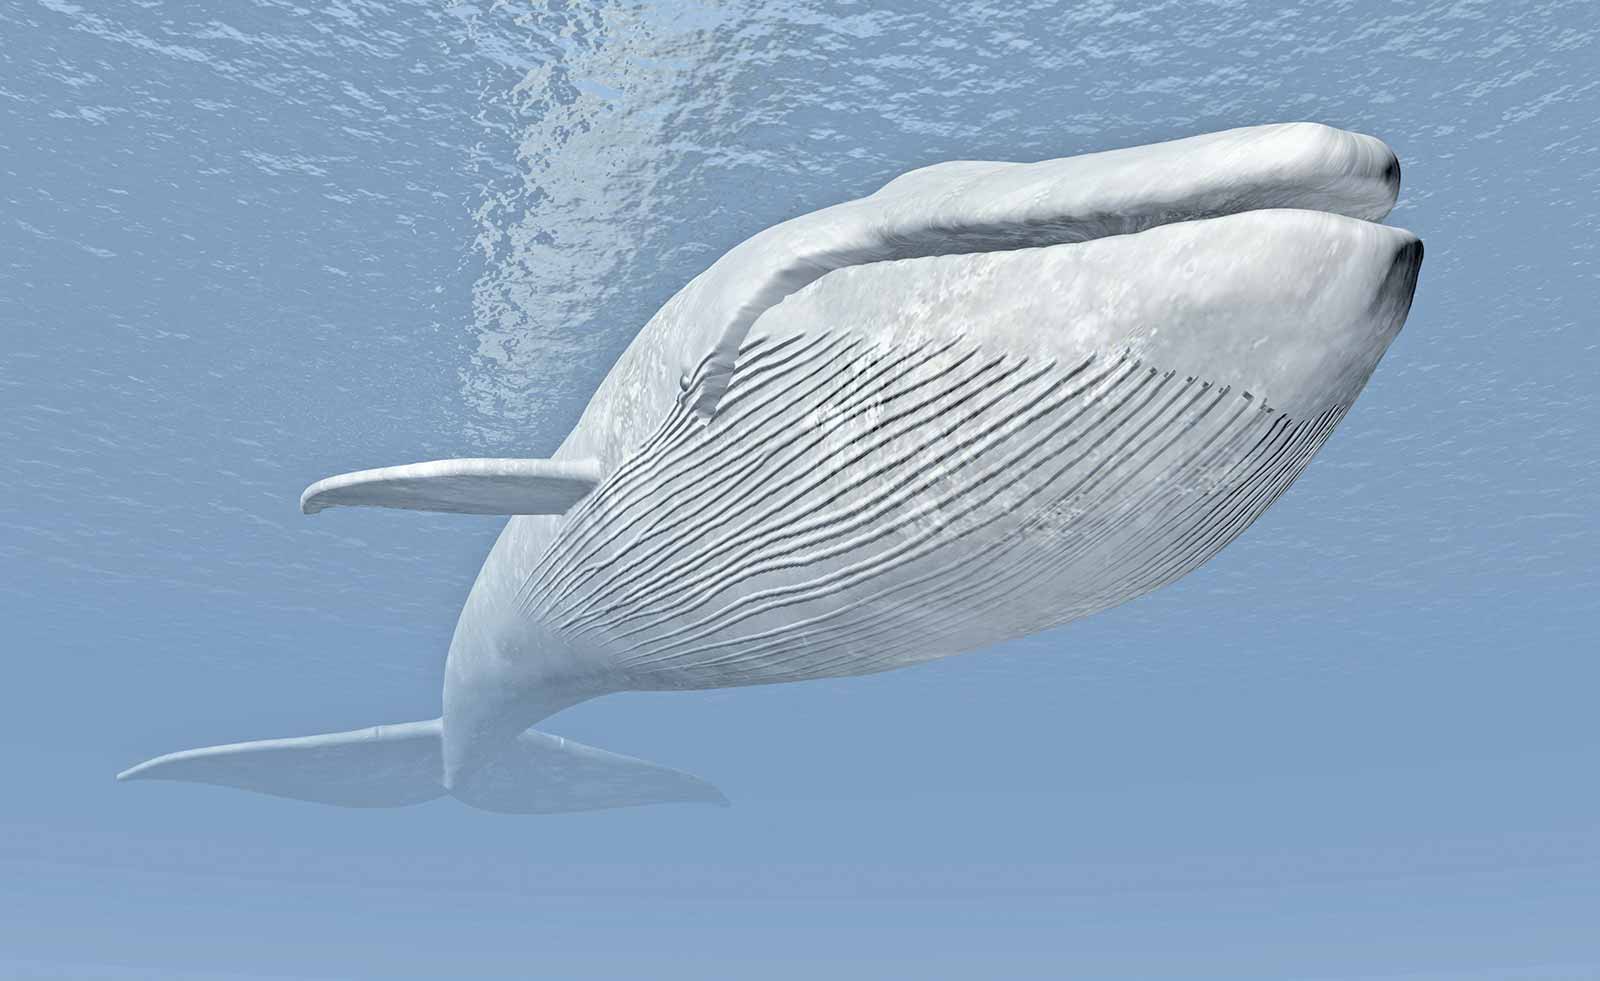
BLUE WHALE (IMAGE: THINKSTOCK PHOTOS)

BONNEY COAST UPWELLING AVERAGE PRODUCTIVITY
The Bonney Coast Upwelling is one of nine enhanced pelagic productivity Key Ecological Features identified in Australia’s Commonwealth waters. From November to May, the surface waters of the Bonney Coast are blown offshore by south-easterly winds and replaced by cold, nutrient-rich water. The sunlit nutrients fuel an explosion of phytoplankton that sustains hordes of marine life, from krill to blue whales. The upwelling is represented by the strong splash of red in this map of average productivity.
Statistical analysis of satellite monitoring data indicates a slight, long term trend of decreasing productivity in the Bonney Coast Upwelling during the past 15 years. The area of productivity decline is highlighted by the blue-green colour band on the map below.
The grey dots on the graph below represent the actual observations of productivity (for a single location in the Bonney Upwelling). The light blue line represents the changes in productivity that occur seasonally (from winter to summer within a year) and the descending green line represents the estimated long-term trend in productivity.

BONNEY COAST UPWELLING AVERAGE PRODUCTIVITY

BONNEY COAST UPWELLING: PREDICTED RESPONSES TO PRESSURE SCENARIOS IN THE MEDIUM TERM (15 YEARS)
Qualitative modelling of the Bonney Coast Upwelling, conducted before the analysis of monitoring data, identified climate change as a possible cause of decreased productivity. As part of the qualitative modelling, five pressure scenarios were modelled to consider the effects of different potential pressure combinations on components and processes of the upwelling system. The model results were then compared with measured trends in indicators such as phytoplankton biomass and the strength of the upwelling itself. The slight, long term decline in productivity identified by the statistical model supports the pressure scenario in which climate change caused a decrease in the upwelling (circled in green above).
A continued decrease in the upwelling is likely to have negative effects on marine life. More indicators would need to be monitored in order to understand the causes and effects of this change, and to discriminate between alternative theories about the potential role of climate change. According to the qualitative models, useful measures would be: the abundance of fur seals, concentrations of sunlit zone dissolved inorganic nitrogen, meteorological-oceanic processes that drive the upwelling, and the biomass of krill or number of blue whales.

We invest heavily in the marine environment but lack the monitoring to support an informed evaluation of the investments. Without monitoring we cannot determine which parts of our marine ecosystem should be a cause for concern, nor which activities require enhanced management.
Towards a blueprint provides a clearly articulated and logically consistent approach to monitoring the status and trends of identified marine assets. It provides a sound foundation on which to develop a national marine monitoring capability that can be adjusted and built on as our knowledge increases. Importantly, it provides an opportunity to work together and make the most of what will always be a monitoring resource that will never quell our curiosity.

Within the Integrated Marine Observing System we have been undertaking systematic and sustained observing of Australia’s marine environment for the past decade, making all of the data openly accessible. Our research interests span from climate change to ecosystem responses. However the state of knowledge about what to observe for ocean physics is currently much greater than for ecological features.
We need end users such as the Department of the Environment to work with research partners such as the Marine Biodiversity Hub to more clearly articulate the requirements for sustained ecological observing. Towards a blueprint is an important document in this context. It sets out a framework for us to engage in this important discussion in a way that is both scientifically robust, and application relevant.
When combined with experimental process studies, long-term ecosystem monitoring provides the context and evidence base for managing marine industries, evaluating regulatory regimes, and conserving high-value assets. It also helps determine the effectiveness of conservation measures in protected and unprotected areas, and the addition of social and economic parameters helps to determine ‘socially acceptable impacts’.
The National Marine Science Plan recently called for a coordinated, long-term national marine monitoring program to help better understand the vulnerability and resilience of marine systems, and better support marine park managers, policymakers, marine industries and regulators. The work by the NERP Marine Biodiversity Hub in developing Towards a blueprint is a great first step in facilitating the development of such a national monitoring program.

Managing Australia’s extensive marine environment is challenging on many levels. The expanse of our coastline and the logistics involved in monitoring our oceans are just part of that challenge. Our investment in marine research, can help address those challenges, by ensuring that future marine monitoring efforts in Australia are robust and provide the foundation for guiding continued investment by government and industry. The Marine Biodiversity Hub, as part of the National Environmental Science Programme, is playing an important role in helping us understand Australia’s marine environments, including how best to monitor these complex ecosystems.


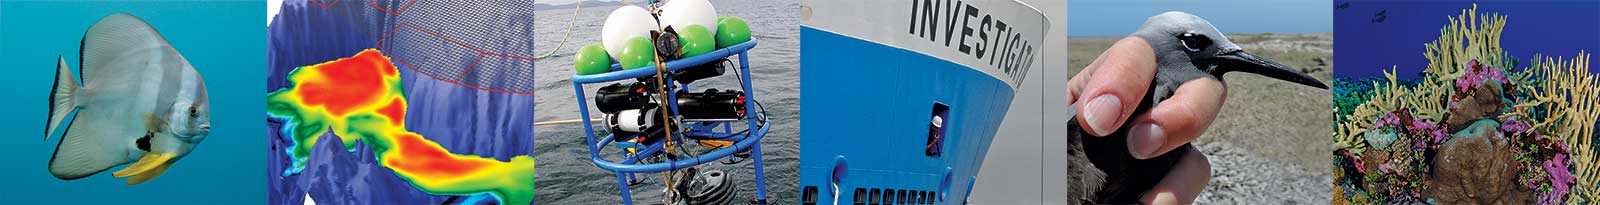
Top banner: Main plankton image: Ruth Erciksen, IMOS/CSIRO. Small images at top: From left to right, CSIRO, Geosciences Australia, B Bennett, CSIRO, Reef Life Survey. Blue whale image: Thinkstock Photos.
Hayes KR, Dambacher JM, Hedge P, Watts D, Foster SD, Thompson PA, Hosack GR, Dunstan PK, Bax NJ and Coombe, N (2015) Towards a Blueprint for monitoring Key Ecological Features in the Commonwealth Marine Area, NERP Marine Biodiversity Hub, Hobart, Australia, 117 pp.*
* This publication can be downloaded from NERP Marine Biodiversity Hub website: Towards a Blueprint for monitoring Key Ecological Features in the Commonwealth Marine Area.
National Environmental Research Program Marine Biodiversity Hub website.
Download the Brochure: Monitoring Australia's oceans: Towards a Blueprint [PDF]
![]()
This site is best viewed using Firefox, Safari, Opera, Chrome IE10, IE11 | Monitoring Australia's oceans: towards a blueprint brochure and website produced by Lightbox42.